
Content
Strategy
This section demonstrates my ability to analyze, structure, and optimize complex information to improve clarity, usability, and decision-making for target audiences. It includes projects where I translated data and content systems into strategic recommendations and audience-focused deliverables.
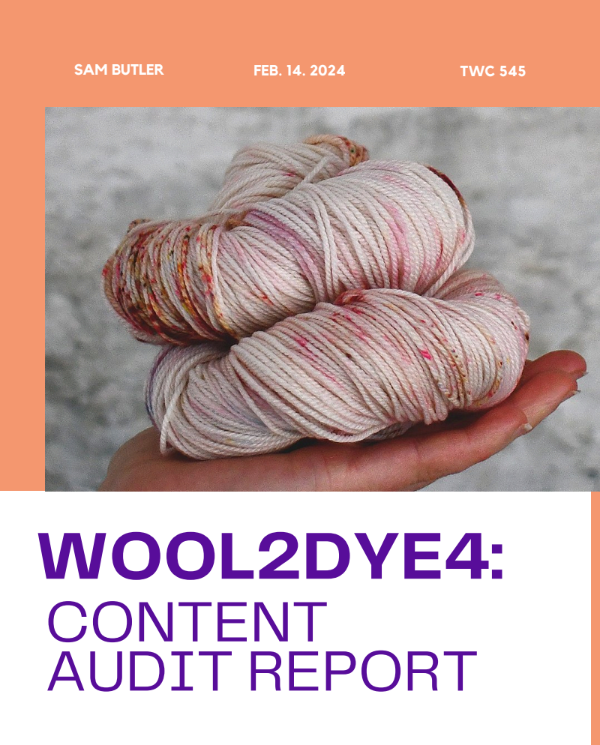
Web content audit + Report
This content analysis and strategy project demonstrates my ability to move from structured analysis to strategic, user-centered communication. I was given the task to evaluate a large set of content for a yarn e-commerce website. In Excel, I created a content inventory to identify patterns, inconsistencies, and gaps across each listing. I documented key attributes such as yarn weight, plies, product photos, titles, skein/package size, descriptions, fiber content, and tags, along with metadata including source, type, channel, and publication date. To ensure consistency, I developed a MAST checklist to establish clear content standards across all listings. I also incorporated user-centered research by evaluating three users aligned with the site’s target persona to assess navigation ease and information findability. Additionally, I used Flesch readability scores from Office 365 metrics to evaluate content clarity and created an XML version of the inventory to support structured data and scalability.
Building on this analysis, I translated my findings into a clear, actionable recommendations report designed for stakeholders. Rather than presenting raw data, I synthesized insights from my checklist and user evaluations to prioritize improvements in usability, clarity, and content consistency. I applied visual design principles in Canva to improve readability and guide the audience through complex findings in an accessible way.
Strengths Acquired:
Rhetorical Knowledge: Adapted communication to stakeholder needs using genre-appropriate conventions and user-centered design principles
Critical Thinking, Analysis, and Research: Conducted structured content analysis and integrated user feedback to evaluate and improve a complex digital system
Practices and Processes: Synthesized research findings into a clear, actionable recommendations report using iterative and audience-aware design strategies
Technology: Utilized Excel, XML, Office 365 metrics, and Canva to organize, analyze, and visually communicate large-scale content data
Imagery in photo provided by Canva stock photos
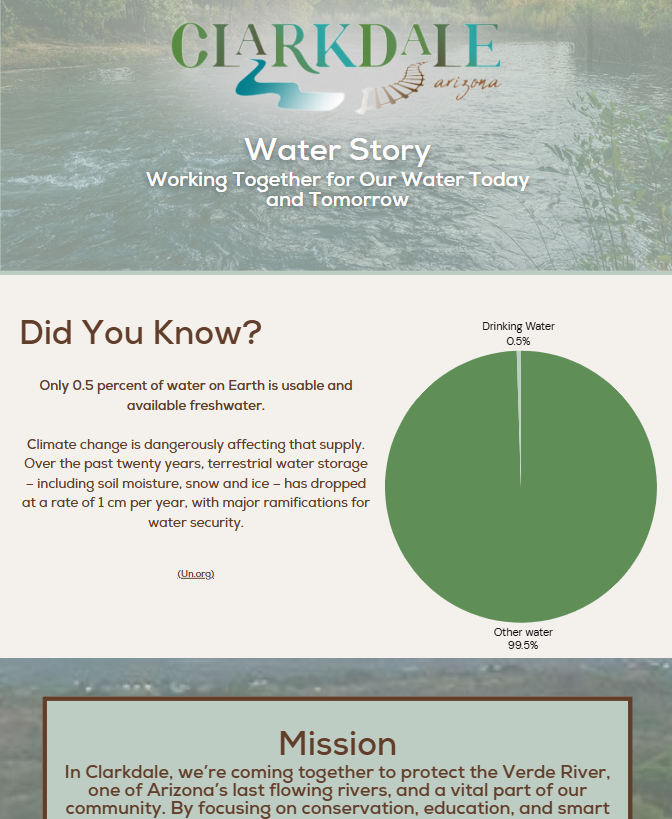
Data visualization report /landing page
his landing page report demonstrates my ability to transform complex environmental and municipal data into a cohesive, visually driven narrative designed for a public audience. Created in Canva and branded for the City of Clarkdale, Arizona, the project synthesizes multiple data visualizations developed throughout the semester into a single storytelling experience about the community’s water supply, usage, and long-term sustainability. Rather than presenting isolated charts, I structured the page to guide users through a clear narrative flow, from water sourcing and population growth to conservation outcomes and projected versus actual usage trends, framing technical data as an accessible public-facing story.
This project strengthened my skills in rhetorical knowledge and user-centered communication by requiring me to adapt technical water infrastructure data for non-specialist audiences while maintaining accuracy and clarity. It also developed my critical thinking and research abilities through interpreting datasets, identifying meaningful trends, and translating those insights into visual and written explanations that support public understanding. In terms of practices and processes, I applied principles of information hierarchy, layout design, and genre conventions for data storytelling to ensure readability and engagement. Additionally, I strengthened my ability to use technology (Canva and its data visualization tools) to integrate charts, narrative text, and branding elements into a unified communication product. Overall, this project reflects my growth in visual rhetoric, data interpretation, and strategic communication for civic and environmental storytelling.
Strengths Acquired:
Rhetorical Knowledge: Translated complex municipal and environmental data into an accessible, audience-centered narrative using visual and written communication strategies
Critical Thinking, Analysis, and Research: Interpreted datasets and identified key trends to support meaningful, public-facing insights about water usage and sustainability
Practices and Processes: Applied information hierarchy, genre conventions, and narrative structure to design a cohesive data storytelling experience
Technology: Utilized Canva and data visualization tools to integrate charts, text, and branding into a unified, visually effective communication product
Imagery in photo provided by Clarkdale County
sunscreen FEASIBILITY report
This feasibility report demonstrates my ability to evaluate, compare, and synthesize product data into a structured, decision-oriented document tailored to a specific audience: ASU students navigating extreme summer heat conditions. Designed with clear sections including an executive summary, methodology, comparative analysis, ranking system, and final recommendations, the report uses both quantitative and qualitative criteria to assess five leading sunscreen brands based on SPF, price, Amazon ratings, reef safety, and product versatility.
This project strengthened my skills in rhetorical knowledge and user-centered communication by translating technical product information (SPF effectiveness, UV exposure risk, and chemical safety considerations) into accessible, actionable guidance for a non-expert audience. It also developed my critical thinking and research abilities through the creation of a structured comparison system that standardized evaluation across multiple variables. Additionally, I gained experience in practices and processes such as organizing complex information hierarchically, applying genre conventions of feasibility reports, and designing readable data visualizations (tables, rankings, and scoring systems). From a technology standpoint, I used Canva to format and present comparative data in a clear, visually structured way. Overall, this project reflects my growth in analysis, audience awareness, and strategic technical communication for practical, real-world decision-making.
Strengths Acquired:
Rhetorical Knowledge: Translated technical product and environmental risk data into clear, audience-centered recommendations for non-expert users
Critical Thinking, Analysis, and Research: Developed and applied a structured evaluation system to compare multiple products across standardized criteria
Practices and Processes: Organized complex information into a clear feasibility report using genre conventions, hierarchy, and data visualization strategies
Technology: Used Canva to design and present comparative data in an accessible, visually structured format
Imagery in photo sourced from Canva stock graphics, Cerve, Supergoop!, EltaMD, Round Lab, and La Roche Posay
TechNical Definition
This technical definition report (“Mercury Retrograde Explained”) demonstrates my ability to translate complex scientific, mythological, and cultural concepts into an accessible, user-centered informational document supported by intentional visual design. I created a structured PDF that integrates written explanation with visual hierarchy, images, captions, and section-based organization to guide reader comprehension. The document breaks down Mercury Retrograde through astronomy, mythology, and astrology, using clear headings, progressive disclosure of information, and visual elements/photographs to support engagement. By combining technical explanation with culturally grounded interpretation, I designed the report to be both informative and approachable for a general audience with varying levels of prior knowledge.
This project strengthened my ability to apply rhetorical knowledge by recognizing how genre conventions of technical definition reports shape clarity, tone, and structure, while emphasizing user-centered communication through accessible explanations and layered content design. I developed strong organization and visual editing strategies by structuring content into logical sections and integrating images and figure references to support understanding. I also demonstrated the ability to communicate in multiple modalities by combining written explanation with visual hierarchy and design elements that improve navigation and engagement. Overall, this work reflects my growth in technical communication, visual organization, and the ability to design informative content that is both academically grounded and engaging for a broad audience.
Strengths Acquired:
Rhetorical Knowledge: Applied genre conventions of technical definition reports to translate complex scientific and cultural concepts into clear, accessible communication for a general audience
Critical Thinking, Analysis, and Research: Synthesized scientific, mythological, and cultural perspectives to create a multi-layered explanation of a complex concept
Practices and Processes: Structured and organized content using progressive disclosure, logical sections, and visual hierarchy to enhance readability and comprehension
Technology: Used digital design tools to integrate text, images, captions, and layout elements into a cohesive, visually guided informational PDF
Imagery in photo provided by Canva stock photos